How to Identify a Trend Reversal?

Learn how to spot a trend reversal in financial markets with simple methods like trend lines, moving averages, and support/resistance levels.

Zeynep Kucukkirali

Duhani Capital Research

Duhani Capital Research

8 Min Read

Dec 10, 2024

how-to-identify-a-trend-reversal

The prices of financial assets move in trends; these trends can sometimes be upward, sometimes downward, and sometimes sideways. However, no trend lasts forever; at some point, a trend ends, and a new trend begins.

Identifying when a trend has ended and reversed is extremely important but can be challenging. Often, retracements can be mistakenly interpreted as trend reversals. According to the golden rules of Dow Theory, a trend continues unless there are clear reversal signals. In this article, we will discuss, especially for beginners, how to identify clear signals of trend reversals using the simplest methods.

Trend Line Breakout

Trend lines are one of the most basic graphical analysis tools that can be used to identify trend reversals. They illustrate the general direction of a financial asset's price; thus, prices crossing the trend line are considered a signal of a trend reversal.

In an uptrend, trend lines are drawn by connecting the lowest points touched by the price, while in a downtrend, they are drawn by connecting the highest points. Drawing these lines requires at least two or more points. How frequently the price touches the trend line and rebounds from these points indicates the effectiveness of the trend line.

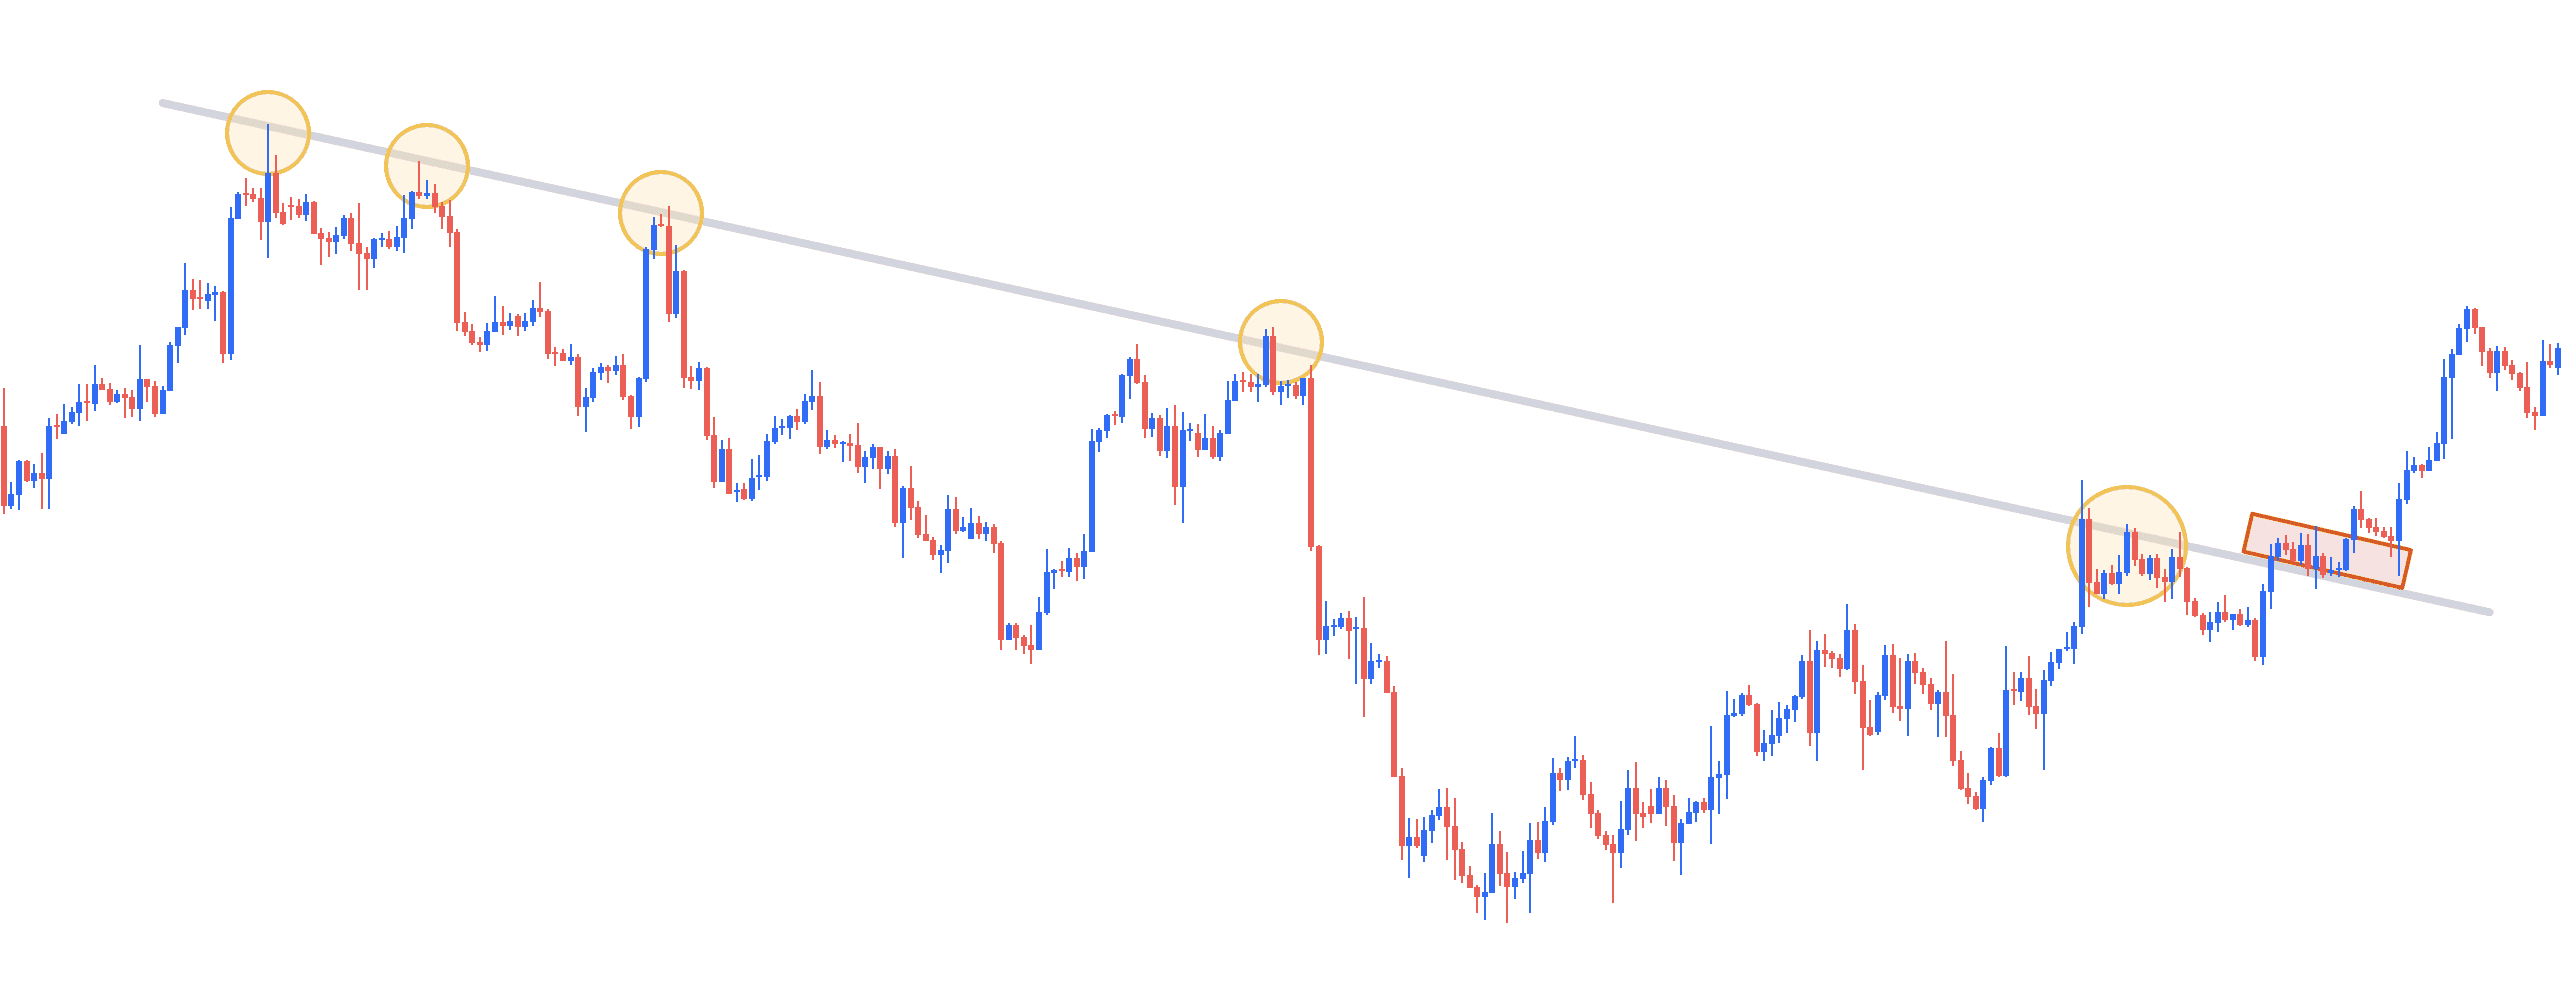
In the chart, the price has touched the trend line several times and has pulled back with downward momentum from these points. This shows that the trend line is effectively working for this asset. On the other hand, movements in the opposite direction of the trend have already started before the price crosses the trend line. However, as long as the price continues to stay below the trend line, it is difficult to definitively say whether these movements represent a trend reversal or just a retracements.

Similarly, stating that the trend has reversed the moment the price crosses above the trend line can be misleading; it is necessary to observe sustained movements above the trend line. As shown in the chart above, if the price crosses above the trend line and then this line acts as support, preventing the price from gaining downward momentum again, a more convincing proof of a trend reversal is obtained.

Moving Average Breakout

Moving averages (MA) are among the most commonly used technical analysis tools in trend analysis. They smooth out price fluctuations by averaging the prices over specific periods, helping us determine the direction of the trend.

In an uptrend, the current price typically tends to stay above the moving averages, while in a downtrend, it remains below the moving averages. In this context, the price crossing in the opposite direction of the moving averages and staying there can be interpreted as a signal of a trend reversal.

Additionally, interactions between moving averages calculated over different periods can be used to confirm trend reversals. A short-term MA crossing above a long-term MA is considered a confirmation of the start of an upward trend, known as a "golden cross." Conversely, a short-term MA crossing below a long-term MA indicates the start of a downward trend, referred to as a "death cross."

The chart includes 20, 50, 100, and 200-day Simple Moving Averages (SMA). Initially, the 20-day SMA crossing below the 50-day SMA indicated the beginning of a downtrend; however, this alone is not sufficient to definitively state a trend reversal.

Subsequently, the 50-day SMA crossing below the 100-day SMA signaled a potential strengthening of the downtrend, but at this stage, it is still uncertain whether this is a pullback or a trend reversal. When confirmed with the trend line, we can still see that the uptrend continues. However, ultimately, the 100-day SMA also crossing below the 200-day SMA provides convincing evidence of a trend reversal.

Support and Resistance Breakout

Another fundamental graphical analysis tool is support and resistance levels. Support refers to the levels where prices halt during a decline and then begin to rise again.

Resistance, conversely, indicates the levels where prices pause during an ascent and start to fall again. These levels are often used in short-term trading to determine entry and exit points for positions. Additionally, breaching certain support or resistance levels can help confirm a trend reversal.

As seen in the chart, a certain support and resistance level has created a trading range. This situation indicates that the market is entering a consolidation phase, after a downward or a upward trend. At the end of this process, the existing trend may continue or reverse.

To confirm whether a trend has reversed or is continuing, it's crucial to first identify areas where the price has concentrated. If the price breaks below the support area and stays below this level, it indicates that a downward trend is continuing (or beginning).

Conversely, if the price surpasses the resistance area and remains above it, this provides strong evidence of the start (or continuation) of an upward trend. As seen in the chart example, although the price has surpassed and then retreated from the resistance area, this area has now served as support, confirming the trend reversal.

Conclusion

In conclusion, the direction of the trend is a vital component of every trader's strategy. Therefore, accurately identifying trend reversals is crucial for developing sound trading strategies and capitalizing on potential market opportunities.

Ready to capitalize on these market shifts?

Duhani Capital delivers what professional traders demand: zero-swap accounts, millisecond execution speeds, and industry-leading 1:1000 leverage to maximize your trading potential. Experience the power of precision trading with an award-winning platform trusted by traders worldwide.

Other Blogs

Stay ahead of the market and refine your strategies with insights from Duhani Capital's Market Analysis Blog.

Stay ahead of the market and refine your strategies with insights from Duhani Capital's Market Analysis Blog.

Stay ahead of the market and refine your strategies with insights from Duhani Capital's Market Analysis Blog.

Quick Link:
Register Address​:

43 Great George Street, St Great George, Roseau, Dominica

Physical Address​:

Rruga Pavaresia, Nd:129 H.5, Ap/27, Durres Albania

Telephone:

+355 524 20144

Email:

support@duhanicapital.com

Disclaimer: This website is owned and operated by Duhani Capital Ltd., prepared in compliance with applicable regulations. It is not intended for distribution, use, or account opening by any individual or entity in jurisdictions where such actions are restricted or prohibited by law, regulation, or internal policies.

Risk Warning: Trading Foreign Exchange (‘Forex’) and Contracts for Difference (‘CFDs’) involves a high level of risk due to leverage, which can amplify both gains and losses. These products may not be suitable for all investors, as you may lose your entire invested capital. It is essential to trade only with capital you are prepared to lose. Before engaging in trading, ensure that you fully understand the risks involved, consider your investment objectives, and seek independent advice if necessary. Please note that Duhani Capital Ltd. operates on an execution-only basis and does not provide financial advice or recommendations.

Restricted Jurisdictions: This website and its services are not intended for individuals residing in or legal entities based in the following jurisdictions, including but not limited to: USA, Cuba, North Korea, Lebanon, Libya, Mali, Myanmar (Burma), Nicaragua, Crimea region, Sevastopol, Somalia, Sudan, South Sudan, Syria, Venezuela, Yemen, Zimbabwe, Japan, and Iran.

Company and Licensing: Duhani Capital Ltd. is incorporated in Dominica and operates in partnership with Financial Master Management Ltd. for trading and dealing in Forex & CFDs. Financial Master Management Ltd. holds the exclusive Master Financial Dealer License (License No: 2023/C0010-0004).

FinCEN Registration: Duhani Capital Ltd. is registered as a Money Services Business (MSB) under the Financial Crimes Enforcement Network (FinCEN), Registration Number: 31000280238735.

Copyright © 2025 Duhani Capital Ltd.